Product experimentation sometimes feels like trying to navigate a labyrinth blindfolded. As a product manager, you grapple with the uncertainty about what to experiment with, decision-making dilemmas, and the complex task of interpreting test results.
What if I told you that you can create and run data-driven product experiments with much less pain and much more certainty? Let’s discuss how to do it with the 5-step product experimentation framework relying on user behavior analytics.

What is Product Experimentation?
Product experimentation is a systematic and data-driven approach used by product teams to make informed decisions about changes or updates. It involves comparing two or more variations of a product or a feature to determine which one performs better in achieving specific goals.
You can use product experimentation for a wide range of product-related decisions, including testing changes in user interface design, adding new features, optimizing pricing strategies, or even validating hypotheses about user behavior.
So, essentially product experimentation is all about enhancing the user experience while minimizing risks associated with product changes.
To create an effective process for product experimentation, organizations rely on a product experimentation framework.
What is a Product Experimentation Framework?
A product experimentation framework is a structured set of guidelines that a product development team follows when planning, conducting, and analyzing experiments on their products.
A solid product experimentation framework can
- streamline the experimentation process,
- improve its effectiveness,
- ensure consistency across experiments.
A product experimentation framework is adaptable — it may vary from one product to another based on their specifics and the product teams’ needs. It serves as a roadmap for conducting experiments and optimizing product development based on empirical evidence.
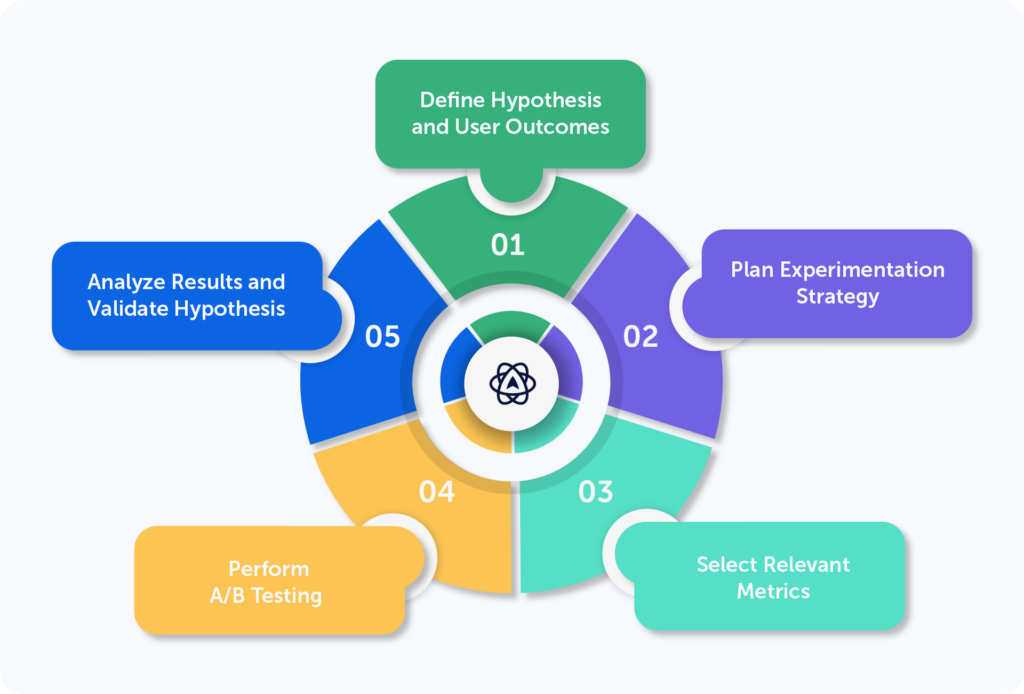
How to Set an Effective Product Experimentation Framework in 5 Steps?
Here are five steps to help product managers build a solid product experimentation framework.

1. Define Hypothesis and User Outcomes
Start by defining a hypothesis that precisely articulates your expectations regarding the impact of a particular product change or feature addition. However, this hypothesis should be specific and quantifiable. Instead of vague predictions like “improving user engagement,” strive for measurable statements like “enhancing feature X visibility will lead to a 15% increase in user engagement.”
Then, define user outcomes. These represent the anticipated benefits that users should experience as a result of the changes you’re making. Ask questions like: What specific problems will this new feature address for our users? How will it enhance their overall experience with our product?
Here are some ideas on where to start when generating hypotheses:
- User behavior analysis: See how users interact with your website and hypothesize what changes might improve their experience.
For example, when you check out website session replays, you might notice that prospects leave because they’re pushed to create an account. According to Drip’s statistics, 34% of users are abandoning their carts for this very reason.
- Feedback channels: Consider using different feedback channels, such as talking to your customer support team. See what questions they’re handling frequently, like payment queries. For example, if UK-based customers are wondering why prices are only in USD and EUR, you can tweak them to include GBP as well, and see if it makes your customers even happier.
- Use your intuition and imagination: There is nothing wrong with following your instincts. So, observe the things that catch your eye or leave you thinking. Then, get inquisitive and ask, “What could be causing this?” Your wild imagination may lead you to some proper hypotheses. However, spend some time gathering evidence to support your hypothesis before jumping to the next stage.
2. Plan Experimentation Strategy
Once you have your hypothesis and user outcomes ready, it’s time to translate them into a concrete action plan.
Begin by identifying the specific changes you want to test in your product. Prioritize these features based on their potential impact on key metrics like conversion rate, average order value, or user retention. This is where ICE scoring (Impact, Confidence, and Ease) may help you.
ICE scoring is a feature prioritization strategy that product managers use to choose optimal product features. You rate those 3 values on a scale from 1 to 10 to make sure you don’t give too much weight to any of them. So, the goal here is to have your feature bank resemble the below table:
| Feature | Impact | Confidence | Ease | ICE scoring |
| Mobile app redesign | 6 | 6 | 7 | 252 |
| One-click checkout | 9 | 8 | 8 | 576 |
| Product search improvement | 8 | 7 | 8 | 448 |
| Payment gateway upgrade | 7 | 6 | 7 | 294 |
| Live chat support | 7 | 7 | 7 | 343 |
As you see, in the example above the top two product features with the highest ICE scores are one-click checkout and product search improvement. For the product team, the next steps would typically involve planning the development of these high-priority features, considering the available resources, timelines, and potential dependencies.
Here’s the simple formula for ICE Score: ICE Score = Impact * Confidence * Ease.
Now, let’s break down what those categories mean:
- Impact: Think about how much this feature can help your business reach its goals. Is it a game-changer or just a little tweak?
- Confidence: How sure are you that the project will achieve the desired impact? Is it a safe bet, or is there a chance it might not go over well? How risky is it?
- Ease: Is it really easy to bring this feature to life, or are you in for a real struggle? A high score means it’s a breeze, while a low score means you’ll have to get your hands dirty (that’s not always intuitive, since higher numbers mean lower complexity – keep that in mind).
Then, define the scope and details of your experiment.
Defining the experiment scope
The scope is your hypothesis and outcomes plus specifics:
-
Duration of the experiment:
- How long will the experiment run for?
- Target user segments
- Which user segments will be part of this experiment? For example, should it be new users or returning users? Or both?
- Variations (A and B)
- What are the differences between Variation A (control group) and Variation B (experimental group)?
- Why are these specific variations chosen for the experiment?
Let’s say, you’re testing personalized product recommendations for your eCommerce business. In this case, you’ll need to specify the criteria for recommendations and the design of recommendation widgets.
3. Select Relevant Metrics
Now, let’s get to the fun part – picking the right metrics to measure your product experiments. But here’s the twist: It isn’t as simple as it seems. In fact, using the wrong metrics is the most common pitfall for many product teams.
Here’s the golden rule: your chosen metrics should align with the goals of your experiment.
If we continue with our eCommerce example, and assume that you’re testing a new checkout process to reduce cart abandonment, metrics like “Cart Abandonment Rate” and “Conversion Rate” would be highly relevant.
Set up data collection mechanisms to track user interactions and behavior during the experiment.
In an eCommerce setting, Mouseflow can provide visual session recordings that show user struggles during the checkout process, allowing you to detect pain points and areas for improvement.
While primary metrics are your main focus, I suggest you consider secondary metrics as they can provide additional context. These metrics can help you understand the broader implications of your changes. For instance, alongside “Conversion Rate,” track “Average Order Value” to make sure that higher conversion isn’t driven by lower-value purchases.
4. Perform A/B Testing
Your experiment is ready, let’s run it! In this phase, product managers perform the A/B testing process to assess the impact of their changes or features.
Ensure that your A/B test involves a clear control group (A) and a treatment group (B) with the proposed changes. The control group should ideally experience no changes, serving as a baseline for comparison.
Calculate the required sample size for your A/B test. It’s essential that your sample size is statistically significant. This means it should be large enough to detect meaningful differences between the control and treatment groups with a reasonable degree of confidence.
You want your test to run for an adequate duration to collect sufficient data. Consider factors like seasonality and traffic patterns that might affect your results. There are tools that can help you understand the duration of the test and the sample size. For example, you can use Optimizely’s A/B test sample size calculator.
Keep external variables constant during the test to isolate the impact of the changes being tested. So, when you make one change at a time, it’s easier to figure out what’s happening without getting skewed data. For example, if you’re testing the impact of a site speed improvement on eCommerce sales, ensure that no other major changes to the website are made during the test period.
For running an A/B test, you’ll likely need an A/B test tool. It could be one from the following list, for example:
- Optimizely
- Convert
- Kameleoon
These tools also help with calculations on the previous stages with determining sample size and statistical significance.
If the initial A/B test results don’t provide a clear outcome or if the changes have a limited impact, consider iterative testing. Refine the experiment based on insights gained and run additional tests to optimize further.
Let’s say your A/B testing for a new product filter didn’t yield a significant improvement in conversion rates. Don’t be discouraged, instead, iterate by adjusting the filter’s design and run a follow-up test.
“You run a test, learn from it, and improve your customer theory and hypotheses. Run a follow-up test, learn from it, and improve your hypotheses. Run a follow-up test, and so on.”
Source: CXL
Tools like Mouseflow, when integrated with A/B testing platforms like Kameleoon, offer powerful capabilities that enhance the testing process.
With the Mouseflow & Kameleoon integration, you gain a deep view of your A/B test variants. For instance, you can filter session recordings by variation, making it easy to observe how users interact with each version of your product. This granular insight is particularly valuable for understanding user behavior and preferences in response to specific changes.
Tracking conversion funnel performance based on A/B test variations is also possible with the Kameleoon and Mouseflow integration. You can monitor how user behavior within the conversion funnel changes with each variant.
5. Analyze Results and Validate Hypothesis
As the last step of building a robust product experimentation strategy, we draw top-level insights from the experiment results.
The main objective is to analyze the data collected during the A/B test phase. This involves a deep dive into the quantitative metrics, statistical significance, and user behavior patterns.
Statistical significance is often the first checkpoint. It helps you determine whether the observed differences between the control and treatment groups are likely due to chance or if they genuinely reflect the impact of your changes. However, statistical significance alone doesn’t tell the whole story.
This is where practical significance, or effect size, comes into play — a concept that goes into the real-world implications of your findings. It’s about assessing not just whether a change is statistically significant but also how meaningful it is in the context of your product and user experience.
Think about how the change influences user behavior. Does it really lead to a significant shift in how users engage with your product, or is it merely a temporary deviation from the norm?
My point is that as a product manager, your role extends beyond recognizing statistical significance. It’s more about evaluating the practical significance of your experiment outcomes.
The Role of Behavioral Analytics in Product Experimentation
While traditional metrics can tell you what changed, they often leave you in the dark about the critical why.
Perhaps your click-through rate (CTR) has increased, bounce rates reduced, or user engagement spiked. But you’re left pondering the why behind these alterations. This is where behavior analytics comes to the forefront, paving the path to data-driven decision-making.
Behavior analytics doesn’t just stop at providing the why – it also helps you assess the relevance of metrics. Plus, behavior analytics shows you bottlenecks in user journeys. It tells you precisely where users face hurdles that hinder their progress. Armed with these insights, product managers can plan experiments and A/B tests more strategically.
One of the most powerful aspects of behavior analytics is its capacity to instill confidence in decision-making. So, instead of relying on assumptions, product managers can base their hypotheses on concrete user data.
Product managers rely on various tools that Mouseflow offers to connect theory with reality:
- Heatmap tool: Heatmaps provide a visual representation of user interactions, showing which areas of your website or product receive the most attention. This visual user engagement data helps product teams pinpoint the most effective locations for CTAs, improving conversion rates for eCommerce stores.
- Session recording tool: Session recordings allow you to view individual user sessions in real-time. This proves invaluable when you need to analyze real user interactions and identify usability issues.
- Friction score: The friction score is like a patience meter for users like me. I know I get frustrated when eCommerce platforms are clunky, like when the product search functionality is unreliable, it takes forever to load, or the website lacks clear navigation. Fortunately, Mouseflow watches for such inconvenient interactions and automatically tags the session recordings with this information.
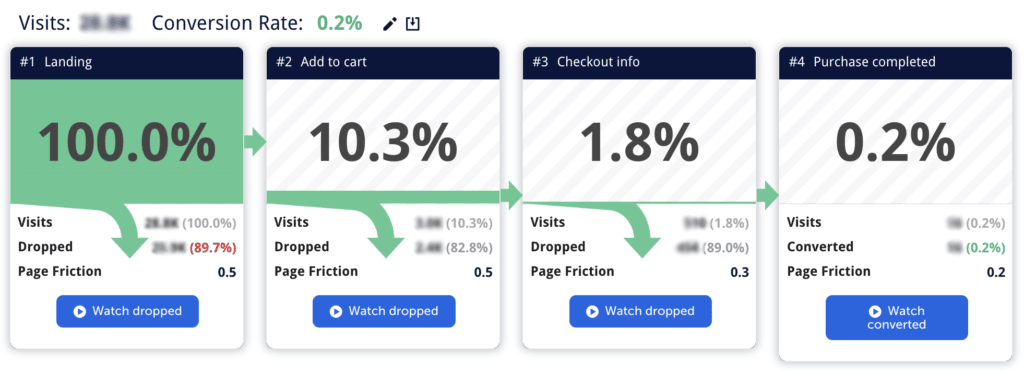
- Conversion funnel analytics: Moseflow’s funnel analytics lets product teams track user journeys step by step, from landing pages to conversions. This feature comes in handy when pinpointing specific drop-off points in the user journey and maximizing conversion rates.

An example of a conversion funnel
Final Thoughts on Product Experimentation
Product experimentation is undeniably a challenging endeavor. Through data-driven insights and a user-centric approach, behavior analytics allows product teams to better navigate the process of experimentation and achieve more successful product development.
Having the right tools on your side makes product experimentation easier. Using Mouseflow, product managers get complete insights into user behavior. With features like session replays, heatmaps, and conversion funnels, Mouseflow provides the data needed to optimize experiments for better user engagement and conversion rates.

